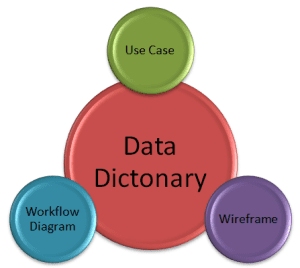
 As a business analyst, it would be rare for you to complete a data dictionary on its own. Rather, it’s likely that you’ll be analyzing data requirements in combination with other business analysis techniques. In this article, we look at how dictionaries can intersect with 3 commonly used business analyst techniques – use cases, user interface wireframes, and a variety of different workflow diagrams.
(By the way, if you are looking to learn more about data modeling, be sure to check out our Free Data Modeling Training.)
For Long Lists of Fields in Use Cases
A use case captures how a user interacts with a software solution to achieve a specific goal. One of the most frequently asked questions from our use case course participants is what to do with long lists of fields that find their way into a use case.
While a certain amount of data information can be incorporated into a use case, once a list spans longer than about 5 fields or starts to include supplemental information about each field, a data dictionary is a better choice.
Connecting these two models is simple. If there is a step inside a use case referencing a collection of fields, simply refer to your data dictionary or a section of your data dictionary from inside the use case.
For Data-Entry Elements in User Interface Wireframes
Similar to use cases, user interface wireframes often contain many data components, often when data is being added or updated. For example, the wireframe screen for creating a new account would contain a user interface element for each piece of data supplied by an end user to create the account.
When this happens, it can be tempting to annotate the wireframe with a lot of data-related rules. Instead, like with a use case, break apart the data elements from a wireframe into a data dictionary, which is specifically designed to handle these rules.
For Data-Related Steps in Workflow Diagrams
Business analysts create workflow diagrams, or models visualizing the steps of a process, to show how business or technical processes flow. Close cousins of workflow diagrams are state diagrams, activity diagrams, and data flow diagrams, which are more specific ways of capturing technical processes. Value stream mapping is a special way of modeling a business process, focusing on the activities that generate the most value to the business.
An activity step in a workflow diagram could involve creating, updating, saving, validating, archiving, or deleting data. Since with workflow diagrams you don’t have a lot of visual room to expand the details of any given step, referencing a set of attributes from a data dictionary is a great practice.
Business Analysts Blend Techniques
While data requirements can be captured using use cases, wireframes, or workflow diagrams, none of these models is designed specifically to help you analyze and organize data requirements. If you find yourself forcing data requirements into a different kind of model or struggling to see the big picture of how all the data requirements relate together, it’s a good sign that a data dictionary would be a useful supplemental specification for your project.
>>Learn More About Data Modeling (Free Training)
Learn the essential Data Modeling Techniques (even if you don’t know how to code) with this free training.