Looking to master the art of clarifying project scope in a flash?
Say hello to the System Context Diagram, your secret solution to project scope!
In today’s world, projects are only becoming more and more complex, and even the tiniest tweak can send ripples through numerous systems.
A System Context Diagram is an elegant solution and visual powerhouse that will have your business and technical stakeholders nodding in agreements as you confidently navigate the intricacies of scope.
Laura guides you through the creation process and unveil the three primary parts of its syntax. You’ll also discover practical examples and insider tips that’ll get you comfortable with utilizing a System Context Diagram.
Are you looking to master the art of clarifying scope in a flash? Say hello to the System Context Diagram, your secret solution to project scope.
Now, in today’s world, projects are only becoming more and more complex, and even that tiniest little tweak in some ripples through numerous different systems. A system context diagram is an elegant solution and a really powerful visual model that will have your business and technical stakeholders nodding in agreement as you confidently navigate the intricacies of scope, especially as it relates to integrated systems.
Hi, I’m Laura Brandenburg with Bridging the Gap, where we help you start, succeed. and excel in your business analyst career with weekly videos on business analysis, tips and techniques.
What Is a System Context Diagram?
Today we’re talking about a system context diagram, which is one type of data flow diagram that captures the data flow at the most abstract level possible. It’s also called a data flow diagram level zero or a DFD Level Zero. A system context diagram shows how one primary system interfaces with the other systems. That sounds really simple, but also kind of like, what does that actually look like? So here’s an example of a system context diagram, and there are three primary elements to the syntax.
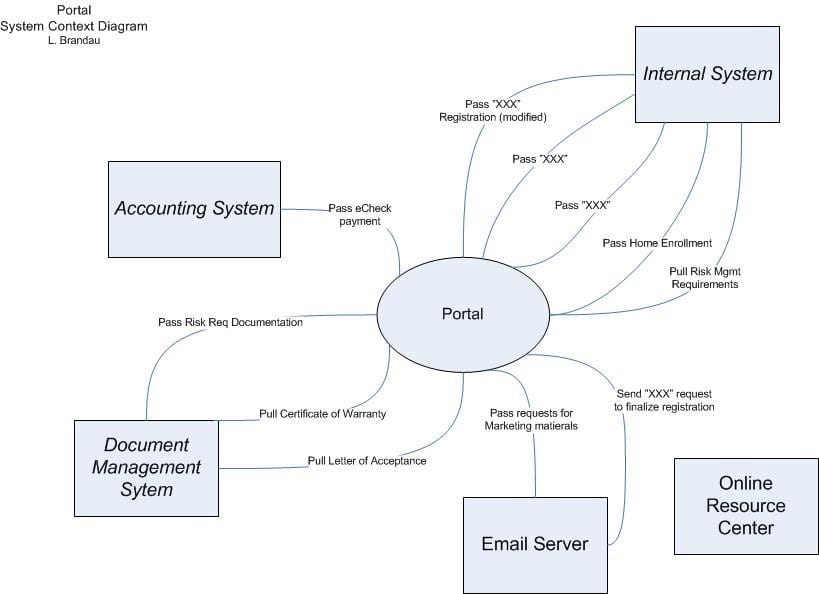
A System Context Diagram has a Core System
First, there’s the core system. In this case that you’re looking at here, the core system is the portal, and it’s represented by the oval in the middle of the diagram. Typically, a system context diagram has only one core system, and in this case, the portal is the new system that’s being built for this project.
A System Context Diagram Shows Integrated Systems
Next are the integrated systems. Each rectangular box represents a system which has an integration point with the new core system. The actual names of these systems in this example have been replaced with generic system names for confidentiality reasons. For example, the accounting system, it could have been QuickBooks, FreshBooks, or Great Plains, any accounting system. You would use your specific systems when you create this. The internal system, in this case, is the client’s preexisting master system that had a proprietary name.
Connect the Core System and Integrated Systems with Integration Lines
The third and final component of this diagram are the integration lines. Each line between the core system and the integrated systems represent what information would be passed between those two systems. The core system is the center of the diagram. Pass and pull are being used to reference that central portal system under design.
For example, the accounting system would pass eCheck information to the portal. You could also represent pass and pull using arrows on the lines just to show direction instead of words. It’s not typical to have a system without a line flowing to or from it.
In this case, we do have an example like that, and that’s the online resource center. That’s because this was an existing version of what’s here called the portal. That was going to be retired. I wanted to be able to explicitly show that there was no relationship between the portal and the resource center. It was on here sort of hanging out without any connections just to show that. It was a great way to really establish the scope of the project visually.
When to Create a System Context Diagram
I personally like to complete this type of diagram during the scoping phrase of the project. This is after you have a clear understanding of the business needs or the problem to be solved, but before you start planning and analyzing the detailed requirements. Thinking about system integrations early prevents a lot of missed requirements later in the development cycle. It gives you a framework to keep your requirements analysis in scope.
Now, if you’re seeking a comprehensive framework to guide your business analysis journey, we have you covered. In one of our other videos, we dive into the essential foundations of the successful business analyst. This video introduces you to our eight step business analysis process framework, empowering you to maximize your effectiveness as a business analyst.
How to Create a System Context Diagram
Let’s talk about how to actually create a system context diagram.
- First, you want to identify what’s the core system for your project and use an oval in the middle to represent it.
- Second, you want to identify any systems that the core system will interact with or share data with and create those rectangular boxes for each of those systems.
- Then you want to identify what types of integrations or data sharing needs need to happen between systems and draw those lines and put the labels or arrows on them. This is the analysis work, and it’s so important as BAs that we actually work with stakeholders to verify, validate, and use these tools to discover information that we might not be privy to otherwise.
- Then you want to review the draft of the model with your project’s business stakeholders. Are you missing any data that they expect to see flowing back and forth? Are you missing any systems that they’re expecting to see integrations with?
- And then you also review with your technical stakeholders. Are there other systems or subsystems that you need to incorporate?
- Iterate through your reviews until everyone is on the same page. Always the goal of the business analyst. Gain alignment and get everyone on the same page.
The System Context Diagram is Just One Data Modeling Technique
The system context diagram, I want to say, is just one of many data modeling techniques most business analysts use a variety of different data modeling techniques to clarify the project scope and avoid missing data requirements.
 In fact, if you’re eager to expand your data modeling toolkit and delve deeper into the world of visual modeling, we have a free entity relationship diagram sample that you can download right now. ERDs are another fantastic visual modeling tool that really helps you understand the interactions within your data or information.
You can claim your free copy now by clicking below.
>> Download Free ERD Sample <<
Also I did a video on Entity Relationship Diagrams (ERDs) and gave a tutorial in that video as well so that you can figure out how to actually create an ERD. Check out that video next by clicking below, and I will see you there.
Frequently Asked Questions About System Context Diagrams
1. What is a System Context Diagram?
A System Context Diagram is a high-level, visual representation that defines how a system interacts with external entities, including other systems, users, and data sources. It helps identify data flows and connections without diving into the internal workings of the system. This type of data flow diagram (also known as DFD Level 0) is particularly useful for clarifying project scope early in the analysis phase, ensuring that all interactions between systems are accounted for.
2. How is a System Context Diagram different from a Data Flow Diagram (DFD)?
While both a System Context Diagram and a Data Flow Diagram (DFD) represent data interactions, a system context diagram focuses solely on the interactions between the core system and external entities, keeping the scope broad. A DFD, on the other hand, often goes into deeper layers of detail, breaking down internal processes, data stores, and data flows within the system itself.
3. Why should business analysts use a System Context Diagram?
Business analysts benefit from using System Context Diagrams because they offer a clear, visual way to communicate the scope of a project, particularly the relationships between systems and external entities. This helps prevent missed requirements by highlighting potential integrations and data flows early in the process, keeping the project focused and aligned with stakeholders’ expectations.
4. How do you create a System Context Diagram?
To create a System Context Diagram, follow these steps:
- Identify the core system and place it in the center of your diagram, typically represented by an oval.
- Identify all external systems, users, or entities interacting with the core system, and place them around it using rectangles.
- Draw lines between the core system and external systems to represent data flows. Label these lines to clarify what information is being shared and in what direction.
- Review the diagram with business and technical stakeholders to ensure it accurately captures all necessary interactions.
5. What are the key elements of a System Context Diagram?
The three primary elements of a System Context Diagram are:
- The core system (represented by an oval) that the project is focused on.
- External systems or entities (represented by rectangles) that interact with the core system.
- Data flows (represented by lines) that indicate the movement of information between the core system and external systems. These can be labeled or arrowed to show direction.